|
|
|
|||||||


| What Does It Mean ? What does this all mean for the Ground Crew ? |
 |
|
|
Thread Tools | Display Modes |
 04-04-2009, 01:02 AM
|
#1 |
|
Avalon Senior Member
Join Date: Sep 2008
Location: U.K.
Posts: 3,380
|
http://www.cosmosmagazine.com/news/2...ot-its-way-out
Is this related to Hoagland and Wilcock hyperdimensional/torsion field theory? SYDNEY: New high-resolution maps of Jupiter have provided the best evidence yet that the planet's Great Red Spot the biggest storm in the Solar System is shrinking. Scientists led by Xylar Asay-Davis at the University of California, Berkeley, collected both new and historical data from instruments mounted on space probes such as Galileo and Cassini and used it to create detailed maps of wind speeds in the planet's atmosphere. "We have shown much more definitively [than before] that the Great Red Spot has been shrinking over the past decade," said Davis, based at the university's Computational Fluid Dynamics Laboratory. 365 km smaller each year From 1996 to 2006, the spot's diameter has shrunk at an average rate of 365 km a year, he said. The research will be published later this year in the journal Icarus. The Red Spot is twice as large as the Earth. The colossal weather system has lasted at least 300 years (when observations began), but may be much older. It has sparked the interest of numerous experts as it offers clues about the climate of Jupiter, a gas giant with no visible solid surface. The storm is made up of gases such as hydrogen, helium, ammonia, methane and water vapour; the same gases and particles that constitute the Jovian atmosphere. What gives it the distinctive red colour has yet to be confirmed, but scientists believe it may result from material drawn up from deeper in Jupiter's atmosphere, below the ammonia clouds. Previously, changes in the size of the spot were estimated by looking at cloud patterns created by the storm. To get a more accurate measure Asay-Davis' team has developed new software using methods for studying fluid dynamics that can precisely follow the movement of cloud patterns over long periods of time. Cloud patterns The shrinking of the spot tells us about the energy balance in the surrounding atmosphere, said Asay-Davis. The amount of energy leaving the Red Spot is not being balanced by the energy the storm is gaining, he said. What has brought this about, though, is not yet known. "My suspicion is that the spot may undergo periods where it grows, and periods where it shrinks, but this is not well understood and we have never seen the Great Red Spot growing," said Davis. Warrick Couch, President of the Astronomical Society of Australia and an astrophysicist at Swinburne University of Technology, in Melbourne, said the research was significant. "The fact that we see gross changes in Jupiter's weather over time is of much interest, given the prominence of the current debate over climate change on Earth," he said. "Advanced instrument technologies and the use of clever measurement techniques are allowing astronomers to get the first glimpses of weather on planets orbiting stars other than our Sun," added Couch. |

|

|
|
04-04-2009, 03:57 AM
|
#2 |
|
Avalon Senior Member
Join Date: Sep 2008
Location: So. Cal. U.S.
Posts: 4,205
|
Nice post, I saw this in the news somewhere, LOL, Oh my god, a scientific/astronomy post here? Next time I run across something like this I'm just going to send you, Orion11, and Luminari and a few others a pm instead of posting it here in the forum because nobody's interested but a few of us.
Last edited by Dantheman62; 04-04-2009 at 05:13 AM. |
|
|
|
|
04-05-2009, 12:00 AM
|
#3 |
|
Avalon Senior Member
Join Date: Feb 2009
Posts: 69
|
Thanks for the post. I'm interested. Reading and researching from a wide variety of sources is helpful for thinking about how things are.
|
|
|
|
|
04-05-2009, 12:25 AM
|
#4 | |
|
Avalon Senior Member
Join Date: Dec 2008
Posts: 694
|
Quote:
|
|
|
|
|

|
04-05-2009, 12:27 AM
|
#5 |
|
Avalon Senior Member
Join Date: Sep 2008
Location: So. Cal. U.S.
Posts: 4,205
|
Yeah I was in a sarcastic mood at the time of my post, LOL
|
|
|
|
|
04-05-2009, 01:14 AM
|
#6 |
|
Banned

Join Date: Dec 2008
Posts: 727
|
Holy cow! Read that again folks!
Its shrinking 365 kms a year. How many years left till it vanishes at that rate? is it some type of count down clock for Earths 365 day orbit? See what I am getting at there? R Hogland and hyperdimensional physics and now what appears to be a possible coincidence in units corresponding with the earths rotation around the sun? |
|
|
|
|
04-05-2009, 03:44 AM
|
#7 | |
|
Avalon Senior Member
Join Date: Sep 2008
Posts: 128
|
Quote:
James McCanney postulates that The Red Spot on Jupiter is in fact a giant hurricane; an electrical storm, and the reason it keeps going and going (like the Energizer Bunny) is that Jupiter is mostly a gaseous planet, hence it has no land mass to "short out" the hurricane. Maybe the reason The Red Spot is shrinking is that there are enough "mass islands" in that gaseous Jovian soup to short the storm out gradually, over time. Last edited by DiVineEnvy; 04-05-2009 at 04:03 AM. |
|
|
|
|
|
04-05-2009, 03:59 AM
|
#8 |
|
Avalon Senior Member
Join Date: Sep 2008
Posts: 128
|
Hmmm...
Last edited by DiVineEnvy; 04-05-2009 at 04:04 AM. |
|
|
|
|
04-05-2009, 04:02 AM
|
#9 |
|
Avalon Senior Member
Join Date: Sep 2008
Posts: 128
|
Or maybe it's something else?
|
|
|
|
|
04-05-2009, 04:32 AM
|
#10 |
|
Avalon Senior Member
Join Date: Sep 2008
Location: So. Cal. U.S.
Posts: 4,205
|
Kind of on a different note, did you know that one of Jupiters moons, Io is the most volcanically active body in the solar system with over 100 active volcanoes?
 Here's a great picture of an eruption on Io..........  I'm still looking for more info on the big red spot! |
|
|
|
|
04-05-2009, 04:35 AM
|
#11 |
|
Avalon Senior Member
Join Date: Sep 2008
Location: So. Cal. U.S.
Posts: 4,205
|
 |
|
|
|
|
04-05-2009, 04:44 AM
|
#12 |
|
Avalon Senior Member
Join Date: Sep 2008
Location: So. Cal. U.S.
Posts: 4,205
|
Jupiter South Pole
 South polar stereographic projection of Jupiter seen from Cassini-Huygens 31 March 2006 This colour map of Jupiter's southern hemisphere was produced from images taken by the NASA/ESA/ASI Cassini-Huygens spacecraft on 11/12 December 2000, during its fly-by of the giant planet on its way to Saturn. This is one of the most detailed global colour maps of Jupiter ever produced; the smallest visible features are about 120 kilometres across. North Pole  North polar stereographic projection of Jupiter seen from Cassini-Huygens |
|
|
|
|
04-05-2009, 04:45 AM
|
#13 |
|
Avalon Senior Member
Join Date: Sep 2008
Location: So. Cal. U.S.
Posts: 4,205
|
Another shot of Io

|
|
|
|
|
04-05-2009, 04:47 AM
|
#14 |
|
Avalon Senior Member
Join Date: Sep 2008
Location: So. Cal. U.S.
Posts: 4,205
|
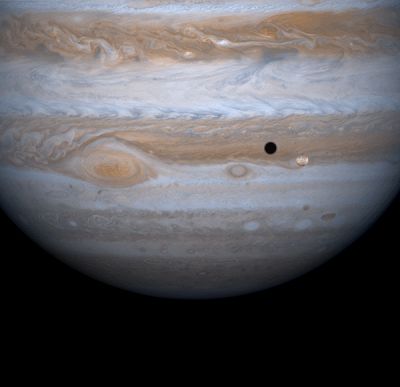
  This is a Hubble Space Telescope image of Jupiter, the largest planet in our Solar System. Note the Great Red Spot, which is a giant gas storm on Jupiter. This storm is said to be more than 300 000 years old. This is a Hubble Space Telescope image of Jupiter, the largest planet in our Solar System. Note the Great Red Spot, which is a giant gas storm on Jupiter. This storm is said to be more than 300 000 years old.  The Hubble telescope's sharp view of the rapid, spectacular dance of luminescent gases high in Jupiter's atmosphere - better known as aurora - is allowing astronomers to map Jupiter's immense magnetic field and better understand how it generates such phenomena. The aurorae are the bright, circular features at the top and bottom of the planet. The Hubble telescope's sharp view of the rapid, spectacular dance of luminescent gases high in Jupiter's atmosphere - better known as aurora - is allowing astronomers to map Jupiter's immense magnetic field and better understand how it generates such phenomena. The aurorae are the bright, circular features at the top and bottom of the planet. Credits: John T. Clarke and Gilda E. Ballester (University of Michigan), John Trauger and Robin Evans (Jet Propulsion Laboratory), and NASA |
|
|
|
|
04-06-2009, 06:28 AM
|
#15 |
|
Avalon Senior Member
Join Date: Sep 2008
Location: So. Cal. U.S.
Posts: 4,205
|
Sorry I got a little carried away with the Jupiter thing instead of the red spot, LOL
|
|
|
|
|
04-06-2009, 06:58 AM
|
#16 |
|
Avalon Senior Member
Join Date: Sep 2008
Location: Auroville, India
Posts: 268
|
What is exactly the relevance of this to Avalon?
Hope I'm not asking a stupid question. Is this related to Hoagland and Wilcock hyperdimensional/torsion field theory? Guess I did. Last edited by avyaktam; 04-06-2009 at 07:02 AM. Reason: Hope I'm not asking a stupid question. |
|
|
|
|
«
Previous Thread
|
Next Thread
»
 Linear Mode

|
|

All times are GMT. The time now is 05:33 AM.